3. Project tree view
Once a project is loaded, the main window displays its content as a tree with different groups.
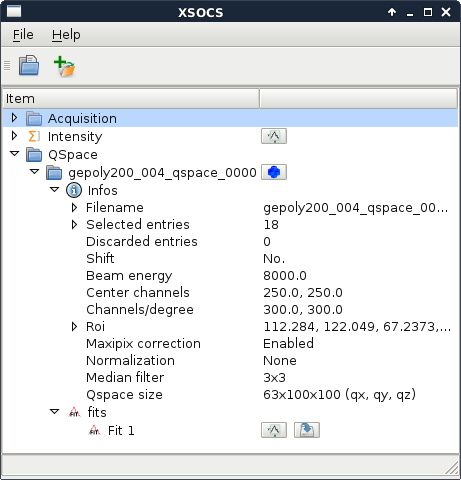
Fig. 3.1 Project tree view
Acquisition group
The Acquisition group contains the raw (merged) data.
Intensity group
The Intensity item represents the cumulated acquired intensity.
You can open the intensity view by clicking on the  button on the same row.
QSpace group
The QSpace group contains the results of all Q space conversions.
Once a Q space has been created from the intensity view it is accessible from here.
QSpace item
The QSpace item represents a single Q space.
It contains:
An
Infosnode, which gives you the parameters that were used when converting images to Q space.A fits group that contains all the fit results for this Q space.
You can open the qspace view by clicking on the  button on the same row.
Q space items can be deleted by selecting them and pressing the delete key. They can be renamed by double clicking on them (the actual file is not renamed). To reset the name just set its name to an empty string.
Q space items also provides a context menu.
Fits group
The fits group contains results for all fits or center of mass run on a given Q space.
Once a fit has been performed from the qspace view it is accessible from this group.
Fit Item
The Fit item represents fit or center-of-mass results.
You can open the fit results view by clicking on the  button on the same row.
You can also export the results to a CSV file by clicking on the  button on the same row.
As for Q space items, Fit items can be deleted by selecting them and pressing the delete key. They can be renamed by double clicking on them (the actual file is not renamed). To reset the name just set its name to an empty string.
Fit items also provides a context menu.