6. Q Space View
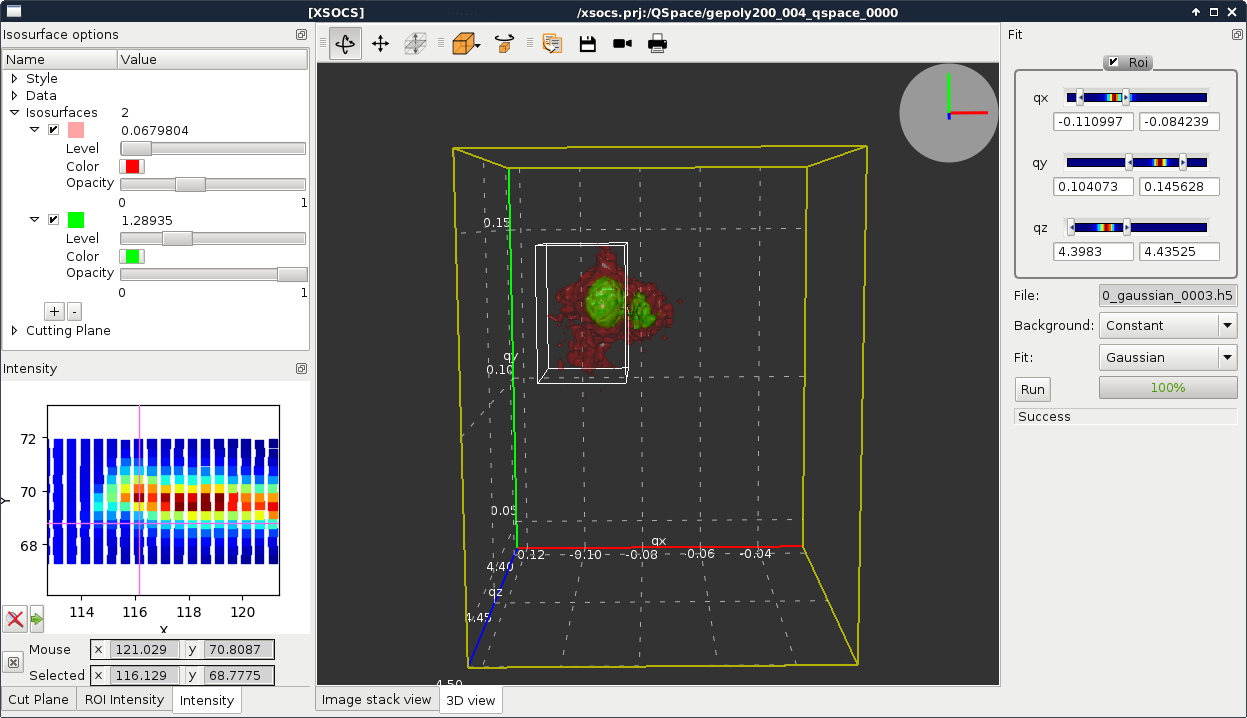
Fig. 6.1 Q space view window
This window allows you to visualize the Q space histogram. You can display the Q space either in 3D (using OpenGL) with Isosurfaces and a Cutting plane or as a stack of images.
You can also select a Q space ROI selection and start Fitting the selected Q space ROI.
3D view
The 3D view is available only if OpenGL 2.1 is available.
Isosurfaces
Isosurfaces can be added/removed and configured from the top left tree widget.
Click on the + (-) to add (remove) an isosurface.
Move the slider or double click on the value and enter a number to change its level.
Toggle the checkbox next to the isosurface color icon to toggle the isosurface visibility.
Cutting plane
A cutting plane can be displayed by expanding the Cutting plane item in the parameter tree (top left of the Q space view) and checking its Visible checkbox.
When visible, the cutting plane can be moved around with the mouse. You can switch between plane and camera control by clicking on the desired control in the toolbar above the 3D view.
A view of the cutting plane is also available in the Cut Plane tab in the bottom left corner of the window.
Stack View
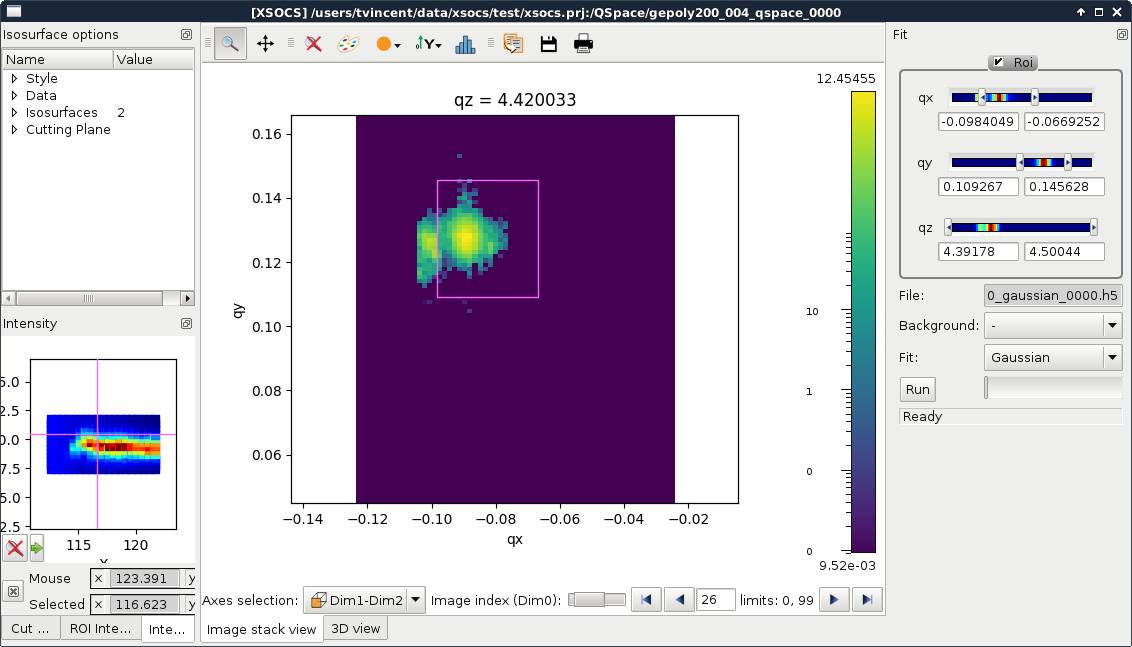
Fig. 6.2 Q space stack view tab
As an alternative to the 3D view of the QSpace, it is also possible to display the Q space histogram as a stack of images with the Image stack view tab.
Fitting
Click on Run to process the data with selected Q space ROI, background and fit method.
Once done, a fit item is added to the project tree. The results are displayed in a fit view window.
ROI selection
The widget on the top right corner of the window allows you to select a 3D Region Of Interest. To enable the ROI, check the Roi checkbox, then move the sliders to change the ROI ranges. The ROI bounding box is displayed in white in the 3D view.
The summed intensity inside the ROI can be visualized in the ROI Intensity tab in the bottom left corner of the window. You have to click on the Update button as it is not refreshed in real time.
Background selection
Three options are available for background subtraction:
-: No background
Constant: Shift data so that the minimum is 0.
Snip: Statistics-sensitive Non-linear Iterative Peak-clipping background estimation algorithm. See snip1d implementation documentation for details and references.
Fit/COM method
Two methods are available:
Gaussian: Fits a single gaussian function on the Q space projected on each axes.
Centroid: Computes the center of mass and maximum.