7. Fit/COM Results View
This view displays the results generated by the fit/COM process.
The left panel shows a preview of the results. Each of those “preview” thumbnails can be dragged and dropped to one of the scatter plots in the center of the window (in the Maps panel).
After selecting a map to display, points can be selected by clicking on the scatter plot. The results along each Q space axis will then be displayed on the three plots on the right (in the Fit panel).
Gaussian fit results
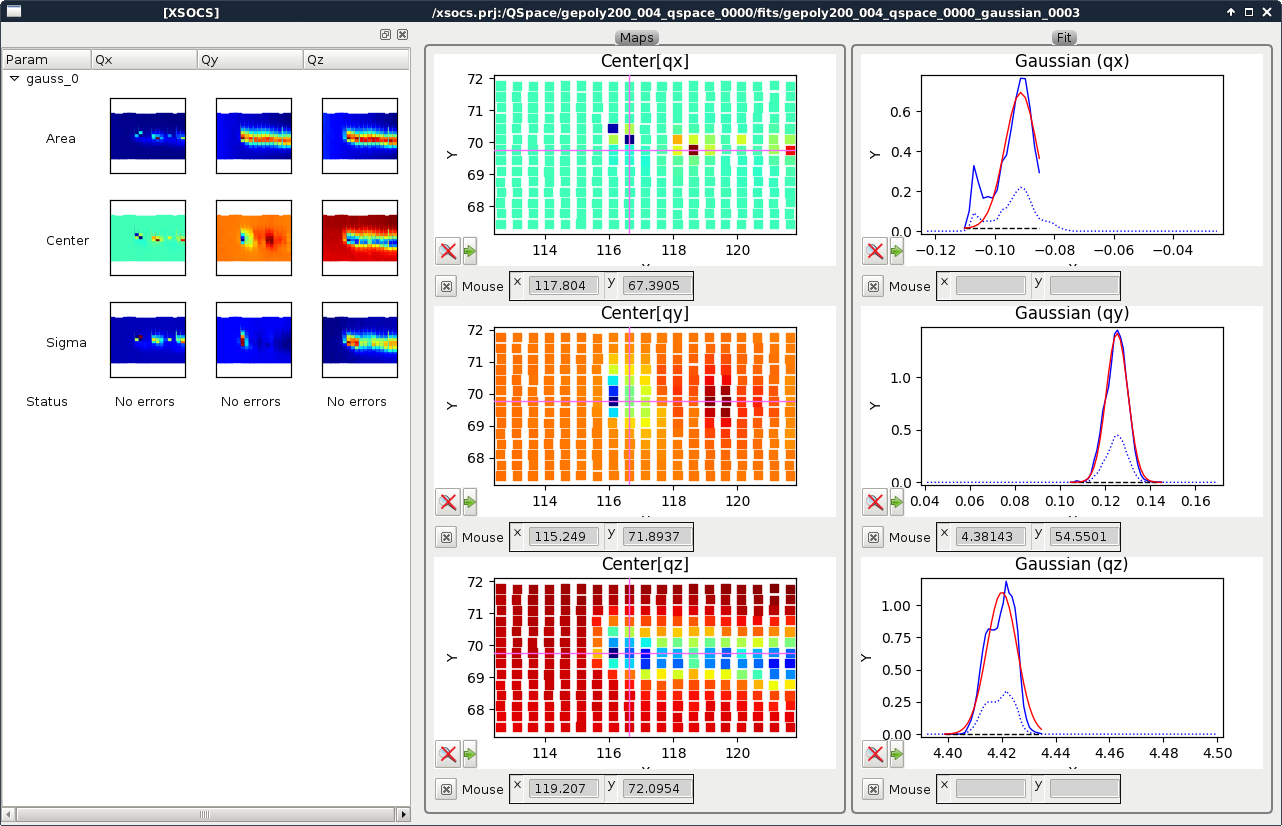
Fig. 7.1 Gaussian fit results view
Available results are:
Area
Center position
Sigma: Standard deviation
The corresponding legends of the right panel plots are:
Blue dashed curve: Integrated intensity on the whole Q space
Blue solid curve: Integrated intensity in the Q space ROI (only when a ROI is set)
Dark dashed curve: Background (only if background is used)
Red solid curve: Fitted gaussian (+ background)
Centroid/Max results
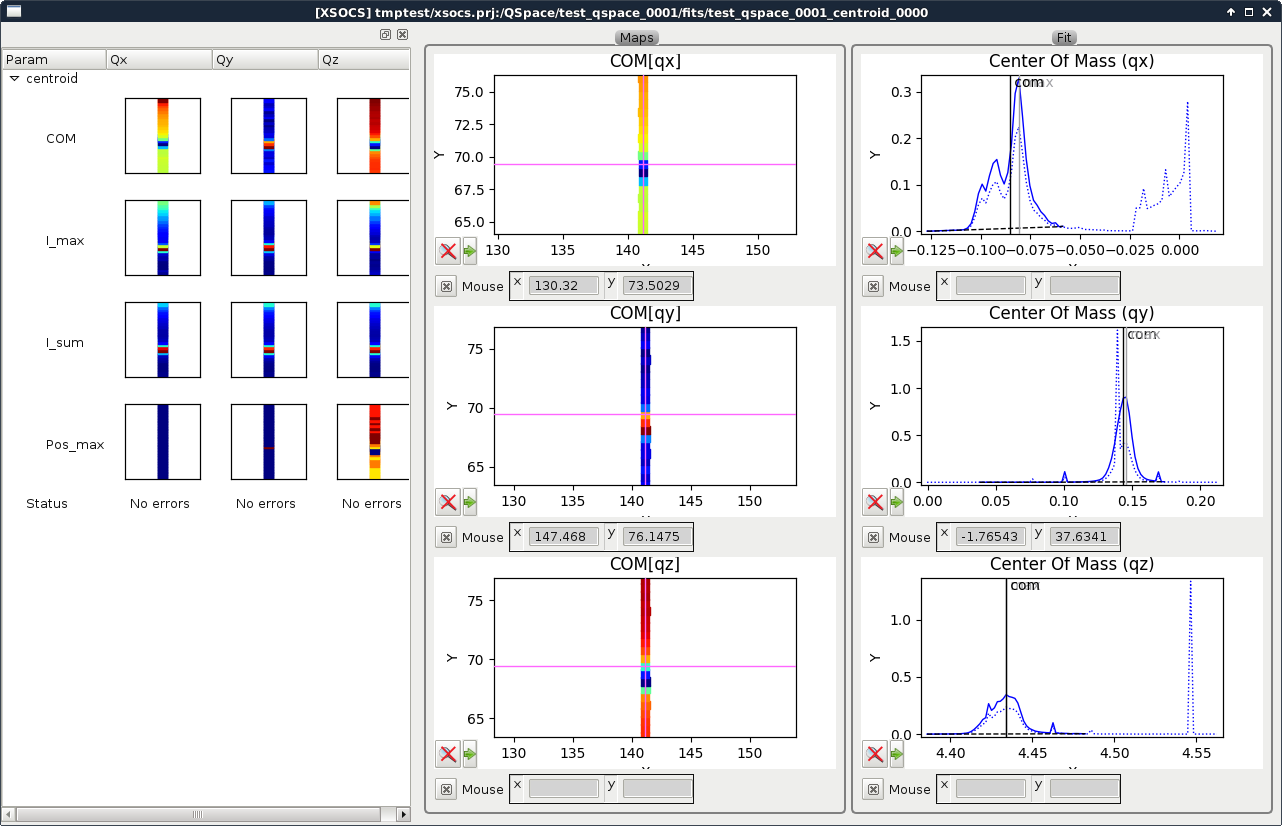
Fig. 7.2 Center-of-mass/Max results view
Available results are:
COM: Center of mass
I_max: Maximum intensity
I_sum: Integrated intensity
Pos_max: Position of maximum
The corresponding legends of the right panel plots are:
Blue dashed curve: Integrated intensity on the whole Q space
Blue solid curve: Integrated intensity in the Q space ROI (only when a ROI is set)
Dark dashed curve: Background (only if background is used)
Vertical black line: centroid position
Vertical gray line: maximum position