4. Intensity View
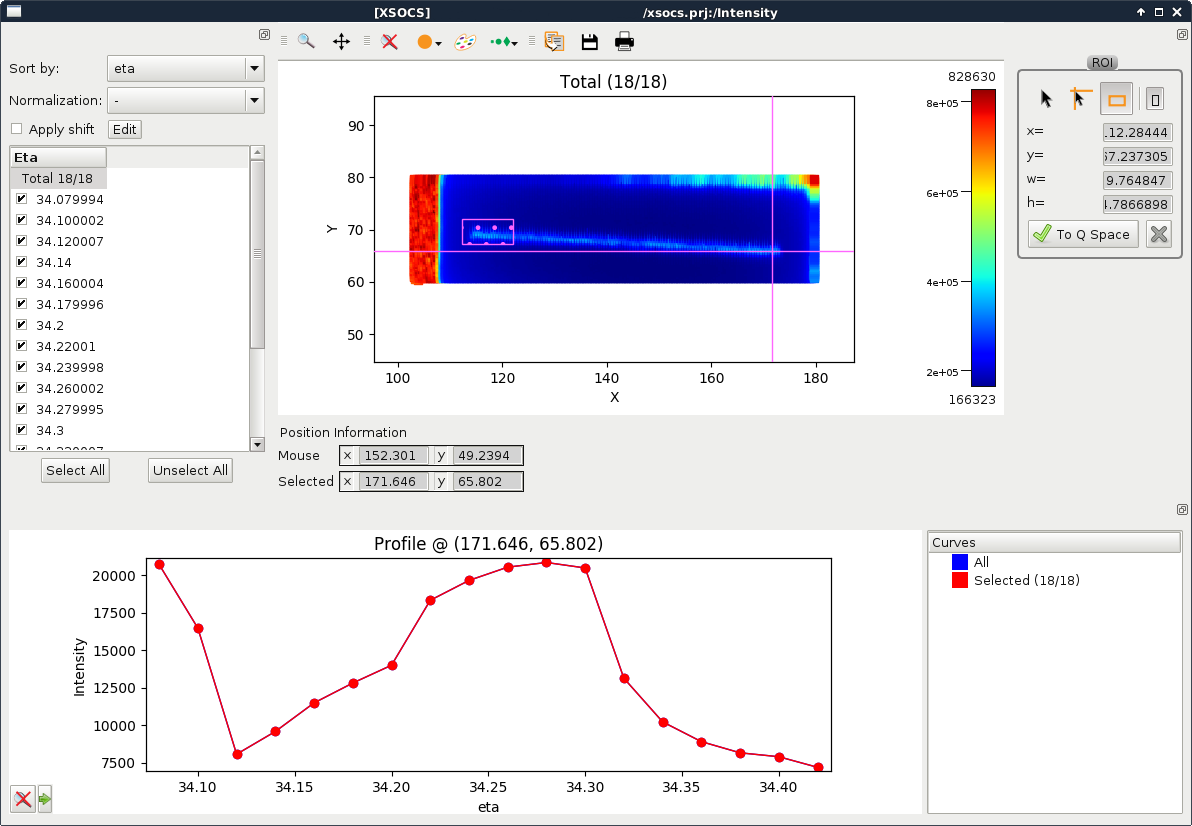
Fig. 4.1 Intensity view
By default, this view displays the total intensity summed over all scans for each point of the sample.
Select displayed data
When an entry is selected in the list on the left, the scatter plot represents the intensity of the acquired images for the selected entry. When the Total item is selected, the total intensity of selected entries is displayed.
It is possible to change the sorting of the scans by changing the selected positioner in the Sort by drop-down list (eta by default).
It is possible to normalize the displayed data with the Normalization drop-down list.
By clicking on a point of the scatter plot, you can display an intensity profile at that point in the lower part of the window.
Shift scan sample positions
It is possible to set some translation of sample position between different scans with the Shift Editor. To open the Shift Editor, click on the Edit button next to the Apply Shift checkbox.
The Apply Shift checkbox toggles the usage of the current scan shifts.
Shift Editor
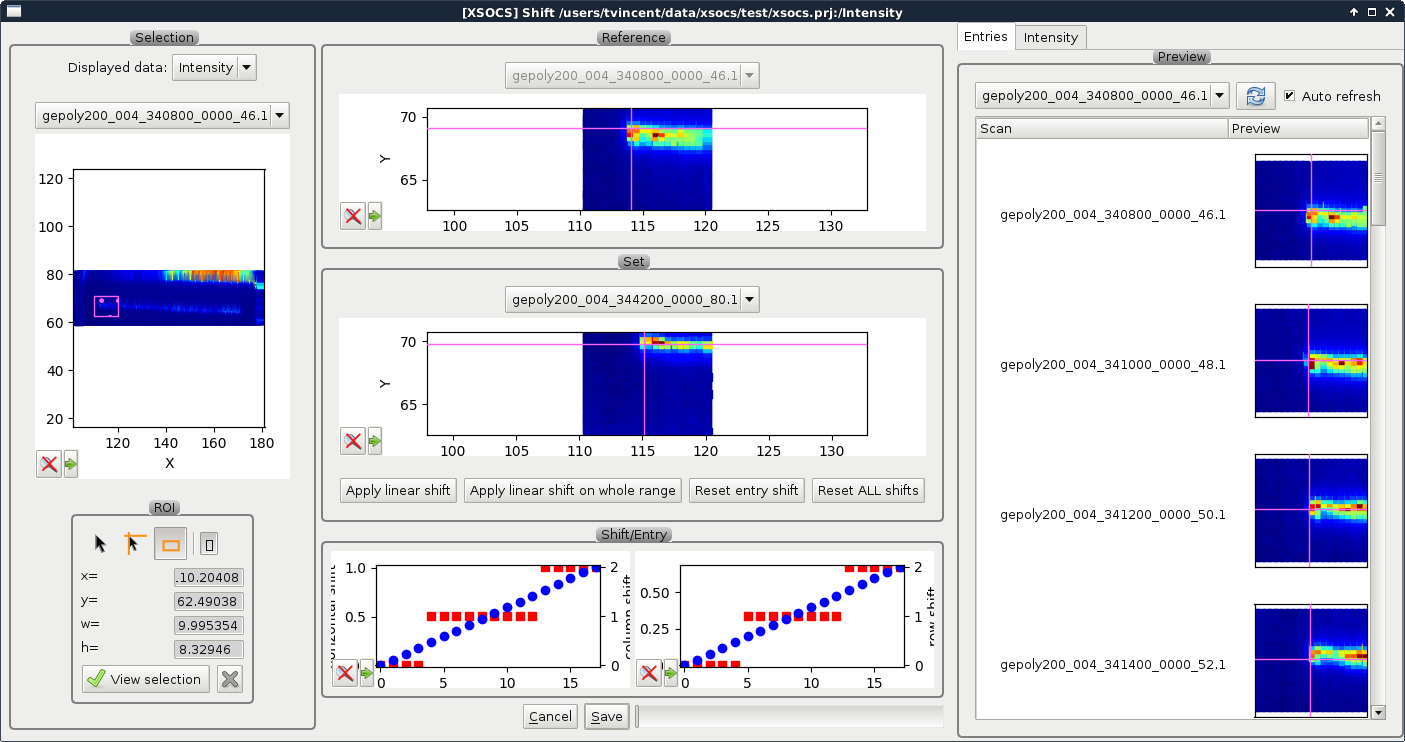
Fig. 4.2 Shift Editor window
The Selection frame on the left enables the selection of the Displayed data and to select a region of interest to be displayed in the central frame with the ROI selection tools and the the View selection button.
The central frame allows to edit the shift by selecting reference position on 2 different scans.
The right frame provides a Preview of the positions that are matched in the Entries tab and a preview of the integrated intensity in the Intensity tab.
Do not forget to save the shift before closing the Shift Editor window with the Save button at the bottom.
Prepare Q space conversion
Click on the  button in the ROI frame on the right side of the window to start a Q space conversion of all sample points.
This opens the QSpace conversion dialog.
button in the ROI frame on the right side of the window to start a Q space conversion of all sample points.
This opens the QSpace conversion dialog.
Select scans
To run a Q space conversion for a subset of the scans, select only the one that you want to use in the list on the left side of the window.
Sample ROI selection
You can select a rectangular ROI to select the sample positions for which you want to run a QSpace conversion.
To draw a ROI, click on the  button in the right frame and then draw the selected area on the scatter plot.
Once this is done, click on the button to open the QSpace conversion dialog.